
What Are The Most Important Metrics In Google Analytics 4?
Have you already made the switch to Google Analytics 4? If not, make sure to make the switch and monitor and familiarize yourself with the amazing new features of the new Analytics.
By tracking the key performance metrics in GA4, you can analyze the right data to make informed decisions and strategies for your online store.
In this blog, you will get an insight into the key metrics to track for your website.
Reach out to us for a free SEO audit on your website!
Table of contents
- What are the dimensions and metrics in Google Analytics 4?
- What's new in Google Analytics 4?
- Types of metrics available in GA4
- What metrics to track in Google Analytics 4?
- Key Takeaways
What are the dimensions and metrics in Google Analytics 4?
Metrics in GA4 are numerical measurements. So, they're all about numbers instead of words.
One really important metric in GA4 is called Active Users. This measures how many different people used your website or app for more than 10 seconds. But, it also counts certain events like the first time someone visits or opens your website or app.
On the contrary, dimensions, or custom dimensions, are attributes that provide more information about your data, usually in words instead of numbers.
Dimensions might include things like:
- The ID of a purchase made on your website
- Where someone was when they used your website or app
- The name of a certain group of people using your website or app.
What's new in Google Analytics 4?
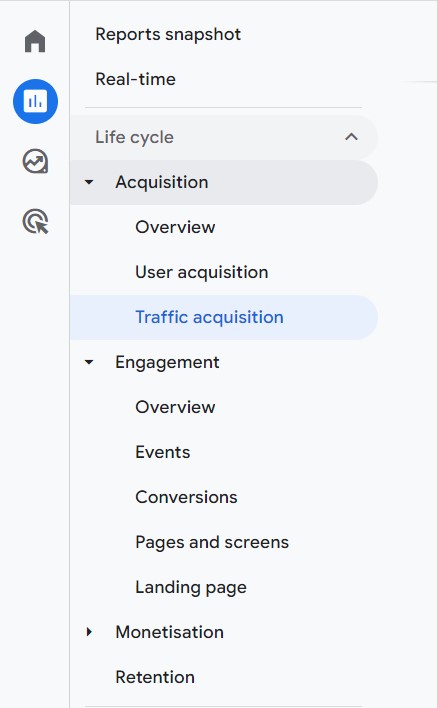
01. Customize Reports
Aside from views, you can also browse, customize, and filter reports.
GA4 now offers additional basic reports as well as customizable reporting to meet your specific requirements.
Previously, property reports could only be accessed via a view. In GA4, you can filter, compare, and grant access to your data, or use a combination of these to simulate view behavior.
02. Set Custom Events and Conversions
GA4 tracks user behavior using events rather than sessions and hits. User engagements on your website or app, such as clicking a button, loading a page, or completing a purchase, are measured by events.
Your most critical events can be marked as conversions in GA4 (equivalent to goals in your original property) and exported to Google Ads for bidding.
03. Create audiences and connect them to Google Ads
Create audiences to group people based on established attributes, historical actions, or expected future behavior (replacing segments in your original property). These audiences can be used in GA4 reports as well as Google Ads.
When you're satisfied with your GA4 conversions and audiences, connect your Google Ads account and configure your campaigns to use GA4 data.
04. Setup Assistant
Track your progress in the Setup Assistant to ensure that all of your key settings are transferred to GA4.
Then, begin with the most recent enhancements and continue your measurement journey in your new GA4 property.
Types of metrics available in GA4
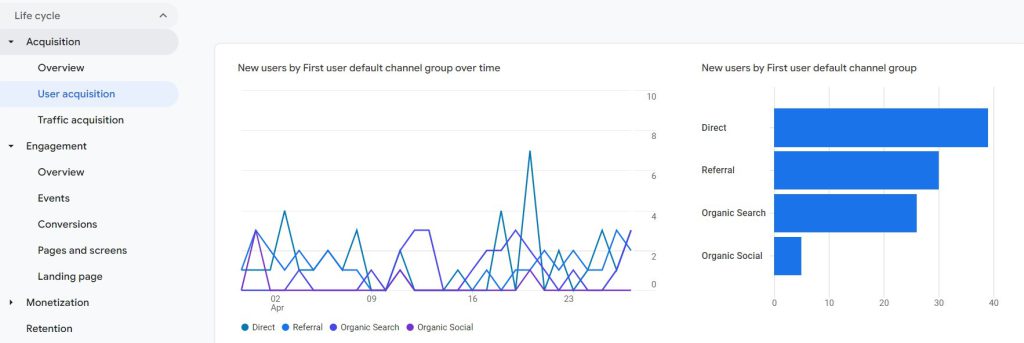
01. Acquisition Metrics
Among the most important GA4 metrics are ones that show how you get new customers. You do this by making people aware of and interested in your clients' brands.
You'll recognize some of these metrics already, but there are also some new ones. Here are a few key metrics for GA4:
- Sessions: how long people spend on your site.
- New Users: people who have never visited your site before.
- Total Users: everyone who's visited your site.
- Event Count: how many things people do on your site.
02. Engagement metrics
Engagement metrics are used to measure how people interact with your client's website and other content, like ads. Some examples are:
- Pageviews (how many times a page is viewed)
- Bounce rate (how often people leave the website after only viewing one page)
- Active users (people who interact with the website)
- Engagement rate (how much people interact with the website)
- Average engagement time (how long people interact with the website on average)
- Conversions (when people take a desired action on the website, like making a purchase)
03. Monetization Metrics
Monetization Metrics are like scorecards to measure how much money your clients make, whether it's through things they sell, ads they run, or subscriptions they offer. There are two important Monetization Metrics in GA4:
1. Customer Lifetime Value (CLV): It's how much money a client expects to make from a customer over time.
2. Total Revenue: It's how much money a client makes overall.
Read More: The Essential SEO KPI Metrics For B2B Marketing
What metrics to track in Google Analytics 4?
01. Users
The GA4 users metric is important for you to know about your website visitors. It shows you how many people have visited your website.
You can use this info to check how well your website is working for your customers.
It also tells you if your content is good or not and if more people are starting to visit your site.
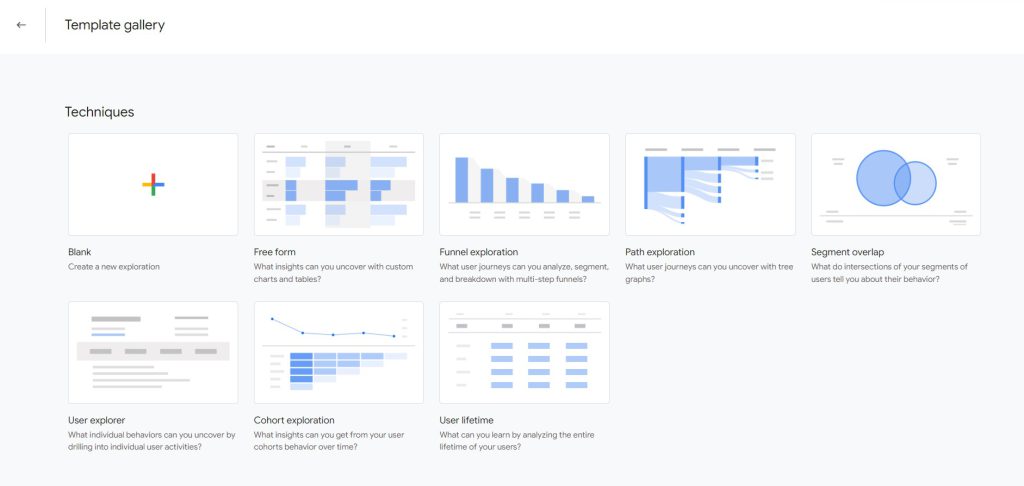
Note: You can create your own reports or choose one from the templates in GA4 to track most of these metrics.
02. Sessions
Sessions are like visits to your webpage or app. They help you learn how many people are checking out your stuff and what they're doing while they're there.
In the past, counting sessions was kind of tricky, but now it's better. Even if the same person comes back more than once or comes from a different link, it's all counted together.
Understanding sessions are super important for figuring out how popular your webpage or app is and what people like doing on it. If you know this stuff, it can help you make improvements and grow your audience.
03. Views
Views are a count of how often a webpage or app screen was seen by your users. By looking at the GA4 views metric, you can make a good plan for your SEO.
Views can also help you spot issues with your webpage and see how tweaks affect user behavior.
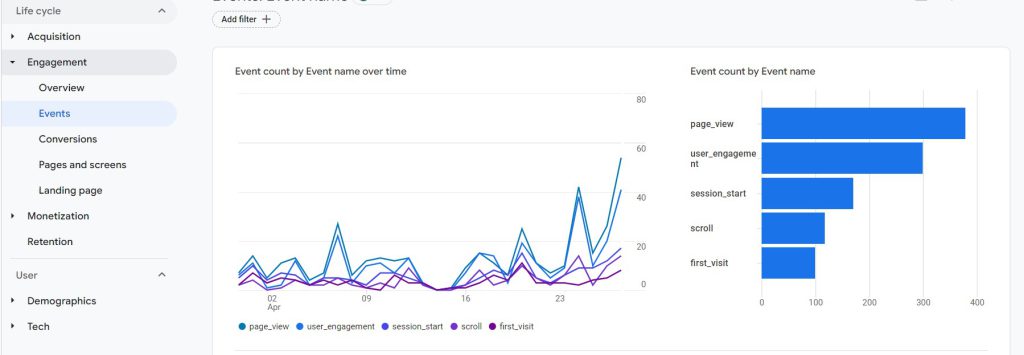
04. Event count
The event count in GA4 shows how many times certain actions occurred in your app.
Knowing how your users move around your app helps you find out more about them.
Once you understand your users better, you can serve them better.
05. Conversions
The Conversions metric in GA4 indicates how many times a user triggered a valuable business event on your webpage.
Tracking these key user actions helps you figure out how to get more out of your investment.
This can show you how engaged your users are, if your webpage is easy to use, how effective your marketing campaigns are and changes in your customers' behaviour. These data points are essential for understanding your business performance.
There are several ways to create conversions here
Read More: 7 Steps To Increase The Conversion Rate of Your Ecommerce Store
06. New vs. Returning Visitors
When people visit your website, they could either be new or they could be returning. This is important to check, so you can find out how many folks are returning to your site.
If a lot of people are returning but not buying anything, you should look at your exit pages to see what's stopping them from making a purchase.
To keep attracting people to your website, you want to have a helpful SEO strategy that answers their questions and gives what they need. This keeps them coming back.
07. Top Exit Pages
When someone visits your website, you want them to find what they're looking for and do what you want them to do. That could mean buying stuff or getting something you offer.
But sometimes, they can't find what they want. So they leave without doing anything. This is not good!
You can see which of your web pages are not doing well and where people leave. If 60% of people leave a page that's supposed to get them to do something, you need to find out what's wrong.
To do this, you can check your website stats and get some answers.
08. The Engagement Rate
The Engagement Rate is the opposite of the Bounce Rate. You can find it in the Session category. This tells you what percentage of visitors are engaged with your client's website.
So, if the Engagement Rate is 70%, the Bounce Rate is 30%. Google says it's calculated by dividing the number of engaged sessions by the total number of sessions for a given time.
09. Total revenue
Total revenue is the total money a company makes from selling things or showing ads. This is important because it helps you see how well your business is doing and if you need to make changes.
By looking at these numbers, the company can see if it's selling more or less over time and trying to make more money.
10. Advertiser Ads Clicks
If you run ads, "Advertiser Ads Clicks" shows how many people clicked the ad. You can find this in GA4 reports if you linked it to ads.
11. Lifetime Value
Lifetime Value is a number that tells you how much a user is worth to your business over time. You can use it to figure out where your users are coming from and where you should put your marketing efforts.
By checking the GA4 lifetime value, you can also know which sources bring you important users. It also helps you understand how much money you need to spend to get a new user.
Key Takeaways
These metrics are just some of the ways to measure and analyze user behavior in Google Analytics. By tracking key performance indicators like users, sessions, views, conversions, engagement rate, total revenue and advertiser ad clicks you can gain valuable insights into your customer's behavior that will help you optimize your marketing efforts.
Moreover, by tracking the key performance indicators in GA4, make informed decisions about how best to reach your target audience.
Reach out to us for a free SEO audit of your website.